Observability, Simplified.
Stop wrestling with complex setups. Dash0 gives your team full visibility into logs, metrics, and traces — in minutes, not months. No lock-in. No surprises.
Trusted by engineers at Vercel, Porsche Digital, Telegraph and more
Trusted by engineering teams at
Observability in Minutes, not Months
No complex setups, no maintenance — all the context for your logs, metrics and traces.
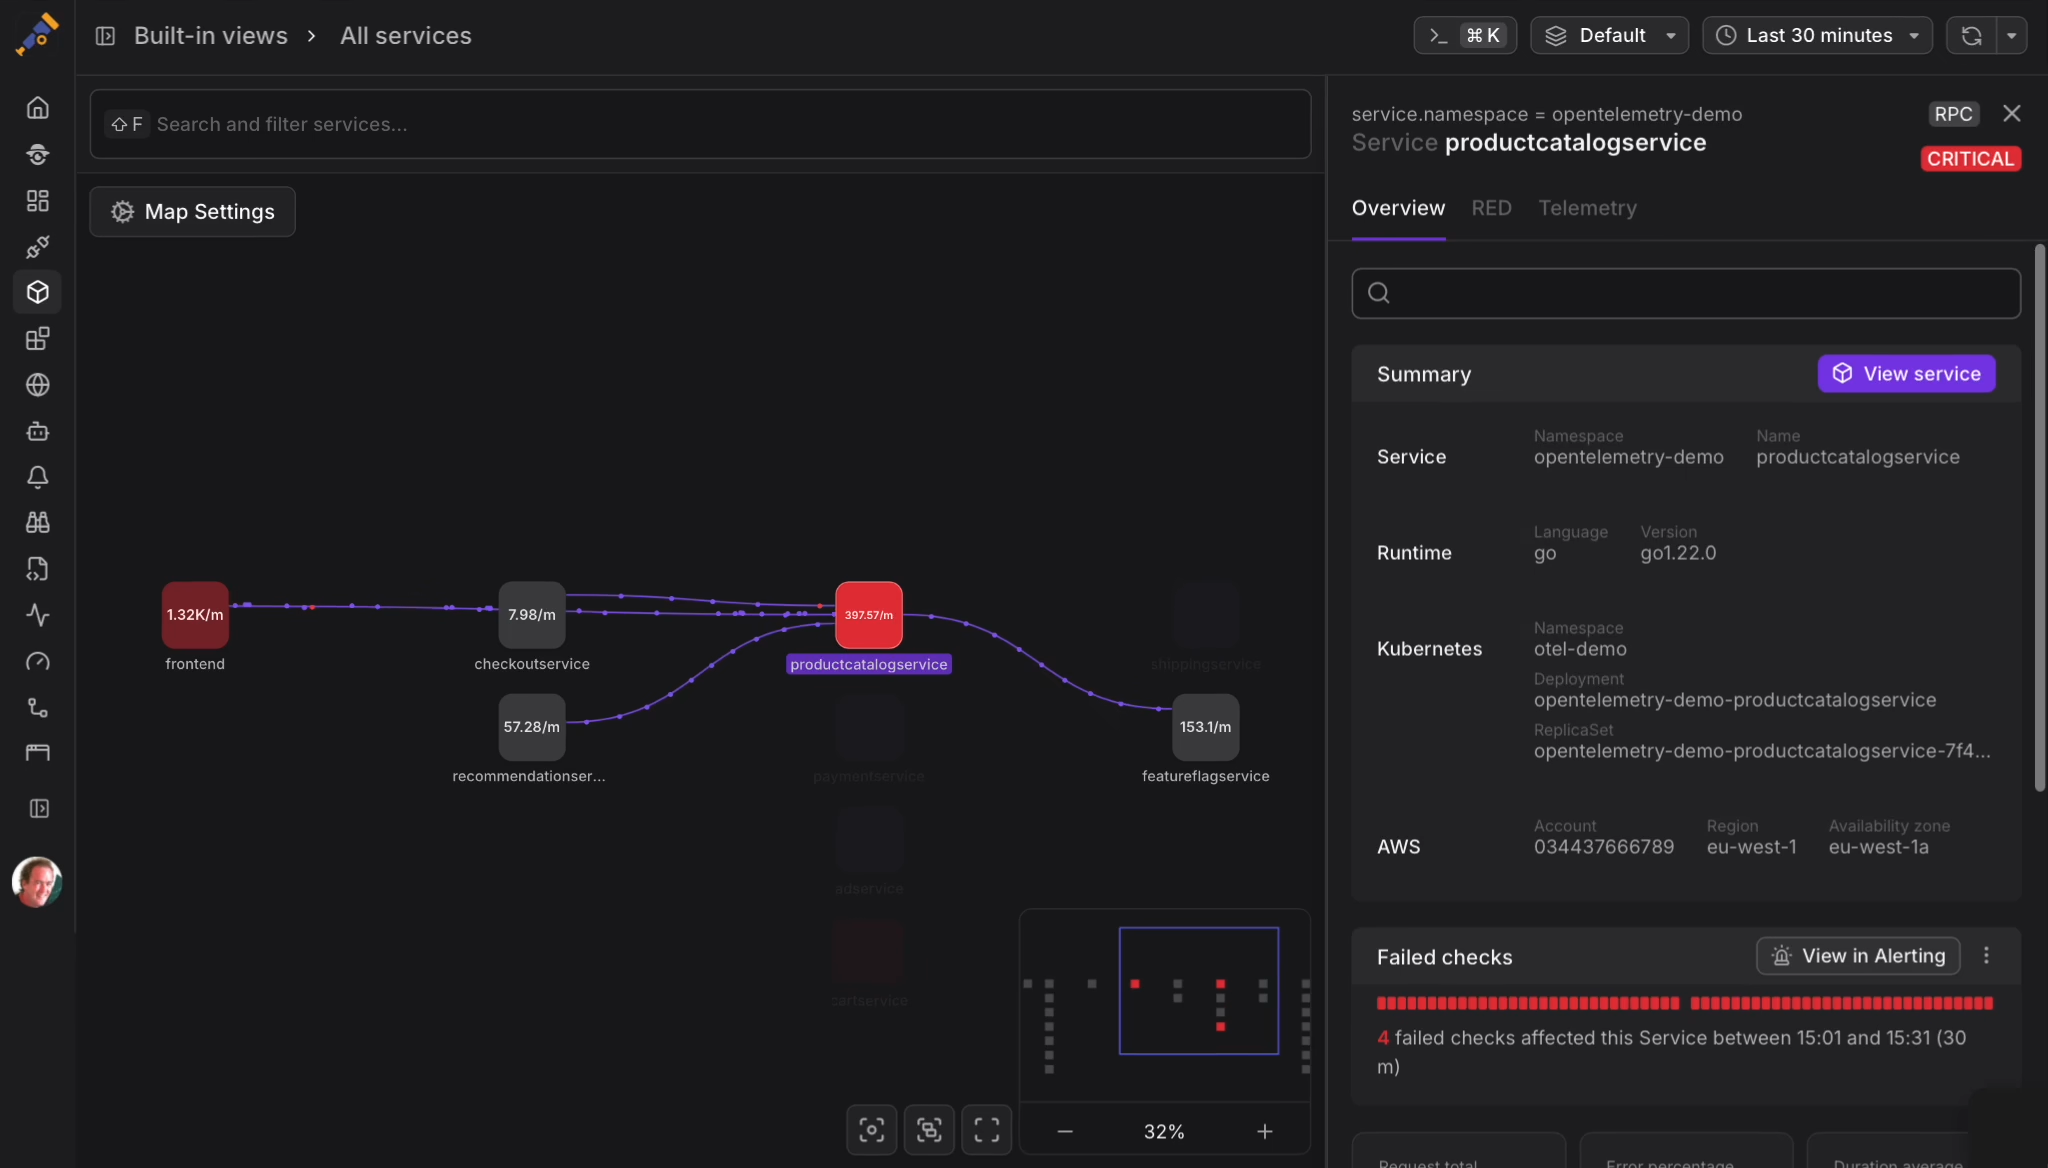
Instant log filtering and search
Manage diverse logs with the fastest search and filtering capabilities. Leverage OpenTelemetry semantic conventions for context, traces, and metrics — spot patterns in a blink.
Monitor the metrics that matter
Centralize Prometheus & OpenTelemetry metrics to monitor your infrastructure and services with ease. Use proven dashboards, integrations and alerts with full context.
Each request, explained
Spot errors and bottlenecks with real-time search and filtering for all high cardinality attributes. Get heatmap drilldowns, trace details, and full context on one page.
Visualize your data with ease
Perses lets you build powerful dashboards to visualize metrics, logs, and traces. Customize with built-in variables, use pre-made dashboards, and manage them as code.
Instant observability for your entire stack
Leverage pre-built integrations, dashboards, alerts, and views. Get started instantly with one click — no customization required.
Built for You — Not for Your Vendor
Dash0 delivers observability on your terms, powered by open standards. No lock-in, no black boxes — just full control, flexibility, and future-proof telemetry.
exporters:
  otlp:
    endpoint: ingress.dash0.com:4317
    headers:
      Authorization: Bearer ${TOKEN}

service:
  pipelines:
    traces:
      exporters: [otlp]
    metrics:
      exporters: [otlp]
    logs:
exporters: [otlp]Interoperability by design
Dash0 is OpenTelemetry-native, enabling standardized and efficient data collection, transmission, and analysis across distributed systems. Enjoy interoperability with modern observability ecosystems.
# P99 latency by service
histogram_quantile(0.99,
  sum by (le, service) (
    rate(http_request_duration_seconds_bucket[5m])
  )
)

# Error rate alert
sum(rate(http_requests_total{
  status=~"5.."}[5m]))
/ sum(rate(http_requests_total[5m]))PromQL: the Cloud-native language
Import your existing Prometheus alerts into Dash0. Take advantage of over 400 pre-built alert templates from open-source knowledge bases. Also query traces and logs with PromQL.
kind: Dashboard
metadata:
  name: service-overview
  project: dash0
spec:
  display:
    name: Service Overview
  panels:
    latency:
      kind: TimeSeriesChart
      spec:
query: http_duration_p99Perses: no more vendor lock-in
Our dashboards are fully compatible with Perses, the open-source platform for creating and managing dashboards. Easily import and export dashboards, providing flexibility and control.
Cost Under Control — No Surprises
Dash0's transparent pricing ensures you always know what you're paying for. No hidden fees, no guesswork — just predictable costs.
Pay just for the telemetry you care about
Our pricing is transparent and based on how many logs, spans, and metric data points you send — not how many bytes, not how many users query them. Send all the metadata you need without hidden costs.
You have all the control
Take full advantage of open-source OpenTelemetry agents and the OTel collector's robust ingestion pipelines to manage your data instrumentation, ingestion, and sampling strategy.
What Our Customers Say
Trusted by engineers at companies of all sizes — from fast-growing startups to global enterprises.
Dash0's foundation on open source standards ensures future-proof and next-gen observability. Their focus on ease of use empowers all of our developers to gain insights quickly.
Patrice Bouillet
Solution Architect - Porsche Digital
The tracing UI is amazing. When we switched to Dash0, it significantly cut down the amount of time from a bug being reported to figuring out why it happened and fixing it. Filtering on attributes is extremely intuitive and the tracing tree UI is best in class.
Elliot Dauber
Software Engineer - Vercel
Despite being a young company, Dash0 delivers enterprise-grade quality and features — automatic instrumentation, spans, logs with semantic context, PromQL support, AI-powered trace triage — all working reliably from day one.
Dennis Schulte
CTO - Hayuno AG
World Class Observability
Our customers praise Dash0 as a powerful product with excellent user experience and support. Dash0 simplifies observability for every developer, providing deep insights into logs, metrics, and traces — because details matter.


No credit card required · 14-day free trial · Cancel anytime